Chartjs Gradient Background post
How to add a gradient background for the entire Chart.js and not just for the dataset, that was my first question when I started to play with it, so here I am...
Chart Plugins
Plugins are the most efficient way to customize or change the default behavior of a chart. They have been introduced at version 2.1.0 (global plugins only) and extended at version 2.5.0 (per chart plugins and options).
With a custom plugin we can draw a custom background implementing the function "beforeDraw".
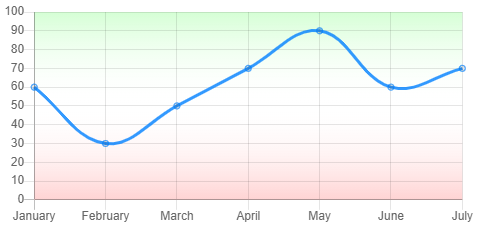
The following plugin draws a custom gradient in the chart background:
    var GradientBgPlugin = {
        beforeDraw: function (chartInstance) {
            const ctx = chartInstance.chart.ctx;
            const canvas = chartInstance.chart.canvas;
            const chartArea = chartInstance.chartArea;

            // Chart background
            var gradientBack = canvas.getContext("2d").createLinearGradient(0, 0, 0, 300);
            gradientBack.addColorStop(0, "rgba(0, 255,0, 0.3)");
            gradientBack.addColorStop(0.5, "rgba(255, 255, 255, 0)");
            gradientBack.addColorStop(1, "rgba(255, 0, 0, 0.3)");

            ctx.fillStyle = gradientBack;
            ctx.fillRect(chartArea.left, chartArea.bottom,
                        chartArea.right - chartArea.left, chartArea.top - chartArea.bottom);
        }
    };
Then insert the custom plugin in the Chart configuration and voilà:
Categories: programming