Chartjs Point with Vertical Line

Chartjs point with vertical line

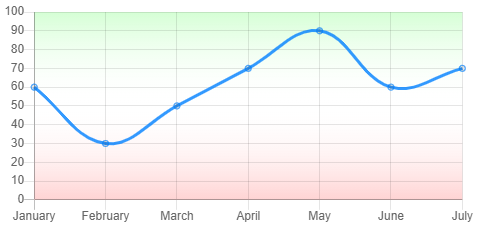
In my journey to adapt Chart.js to fit some of my requirements, I had to draw some points of interest in a line chart and draw a vertical line to the baseline.

The Chartjs plugin system came to my rescue again (see my previous post).

Plugins are the most efficient way to customize or change the default behavior of a chart, but there are not so many examples out there, so I am bringing another one.

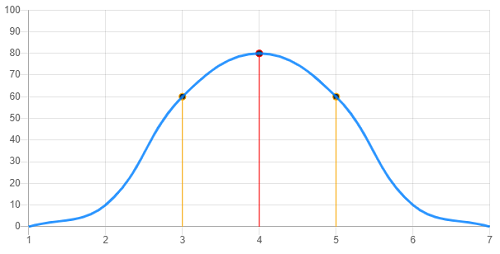
In this line chart I am using a dataset type "scatter" to draw some points of interest in the line dataset, then for these specific point I wish to draw a vertical line from the scatter point to the chart base.

To perform this task, I created the following plugin to implement the hook "afterDatasetDraw" and draw a vertical line if the dataset is "scatter" type:

    var VerticalLinePlugin = {
        afterDatasetDraw: function (chart, params) {
            // Only draw after animation has finished and is the desired dataset
            if(params.easingValue == 1 && params.meta.type == "scatter") {
                var ctx = chart.ctx;
                ctx.save();
                params.meta.data.forEach(point => {
                    var model = point._model;
                    ctx.strokeStyle = point._options.borderColor;
                    ctx.lineWidth = point._options.borderWidth;
                    ctx.beginPath();
                    ctx.moveTo(model.x, model.y);
                    ctx.lineTo(model.x, chart.chartArea.bottom);
                    ctx.stroke();
                });
                ctx.restore();
            }
        }
    };

Insert the custom plugin in the Chart configuration to make it work:

Tags: chartjs, javascript, tips

Chartjs Gradient Background

Chartjs gradient background

How to add a gradient background for the entire Chart.js and not just for the dataset, that was my first question when I started to play with it, so here I am...

Chart Plugins

Plugins are the most efficient way to customize or change the default behavior of a chart. They have been introduced at version 2.1.0 (global plugins only) and extended at version 2.5.0 (per chart plugins and options).

With a custom plugin we can draw a custom background implementing the function "beforeDraw".

The following plugin draws a custom gradient in the chart background:

    var GradientBgPlugin = {
        beforeDraw: function (chartInstance) {
            const ctx = chartInstance.chart.ctx;
            const canvas = chartInstance.chart.canvas;
            const chartArea = chartInstance.chartArea;

            // Chart background
            var gradientBack = canvas.getContext("2d").createLinearGradient(0, 0, 0, 300);
            gradientBack.addColorStop(0, "rgba(0, 255,0, 0.3)");
            gradientBack.addColorStop(0.5, "rgba(255, 255, 255, 0)");
            gradientBack.addColorStop(1, "rgba(255, 0, 0, 0.3)");

            ctx.fillStyle = gradientBack;
            ctx.fillRect(chartArea.left, chartArea.bottom,
                        chartArea.right - chartArea.left, chartArea.top - chartArea.bottom);
        }
    };

Then insert the custom plugin in the Chart configuration and voilĂ :

Tags: chartjs, javascript, tips